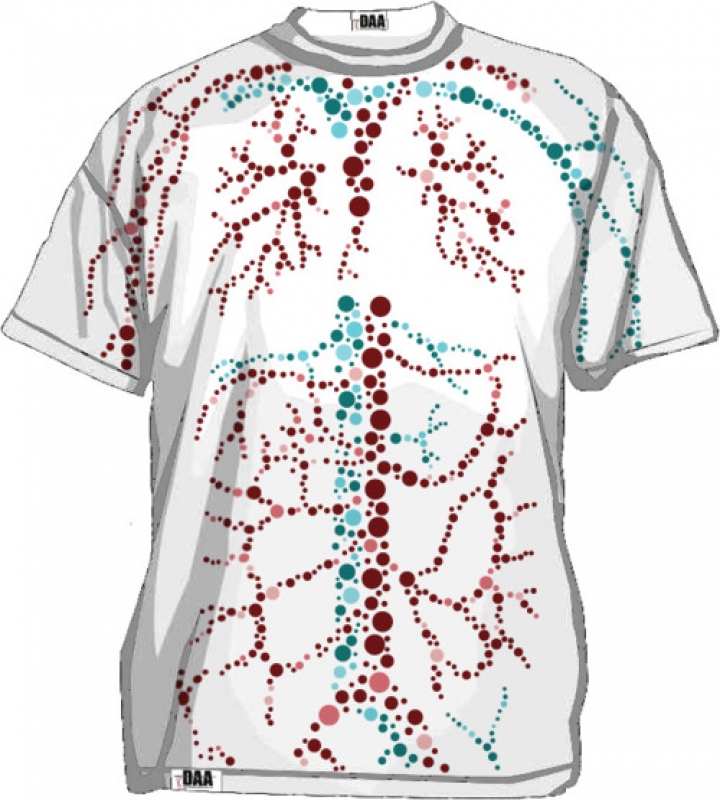
The Media, Art and Design faculty DAA workgroup of Jeffrey, Karolien and Stefan wanted to work on the image of mapping HIV/AIDS facts and figures. We all know that charts and numbers can be quite boring, but it's so important to know what's going on: that the number of HIV infections is still on the rise and most importantly, that it can also happen close to you. That's why they worked out different types of charts, making it visually more attractive. During this process they encountered a test to detect color blindness and they liked the idea of blind spots: something that not everybody can see, but that's always there. The same could be said about HIV/AIDS: is HIV/AIDS a blind spot in our society? Is it the forgotten disease? Do people just don't see the risk they take when having unprotected sex? These two ideas combined gave the group a new direction: they now are working on a anamorphic installation and we hope to see the result very soon. We already love the design of this T-shirt, which was the result of their thinking process so far: blood lines the symbol for live, but also the transport of the HIV virus into the body.